Teaching guides
Short, practical guides for parents and teachers on how to teach the core primary skills, grouped by subject, each with free printable worksheets to practise.
Maths
The core primary number, measurement and data skills, in teaching order.
Number sense & place value
How numbers work before any calculating: counting, place value and comparing.
The four operations
Adding, subtracting, multiplying and dividing, from number bonds to long division.
Factors, primes & powers
Breaking numbers apart: factors, multiples, primes and square numbers.
Fractions & decimals
Parts of a whole, from shaded shapes to decimal place value.
Patterns & algebra
Spotting rules and finding an unknown, the seeds of algebra.
Measurement, geometry, time & money
Measuring and shape, plus reading the clock, calendar and coins.
Data & statistics
Sorting, graphing and averaging data, then reading it critically.
Science
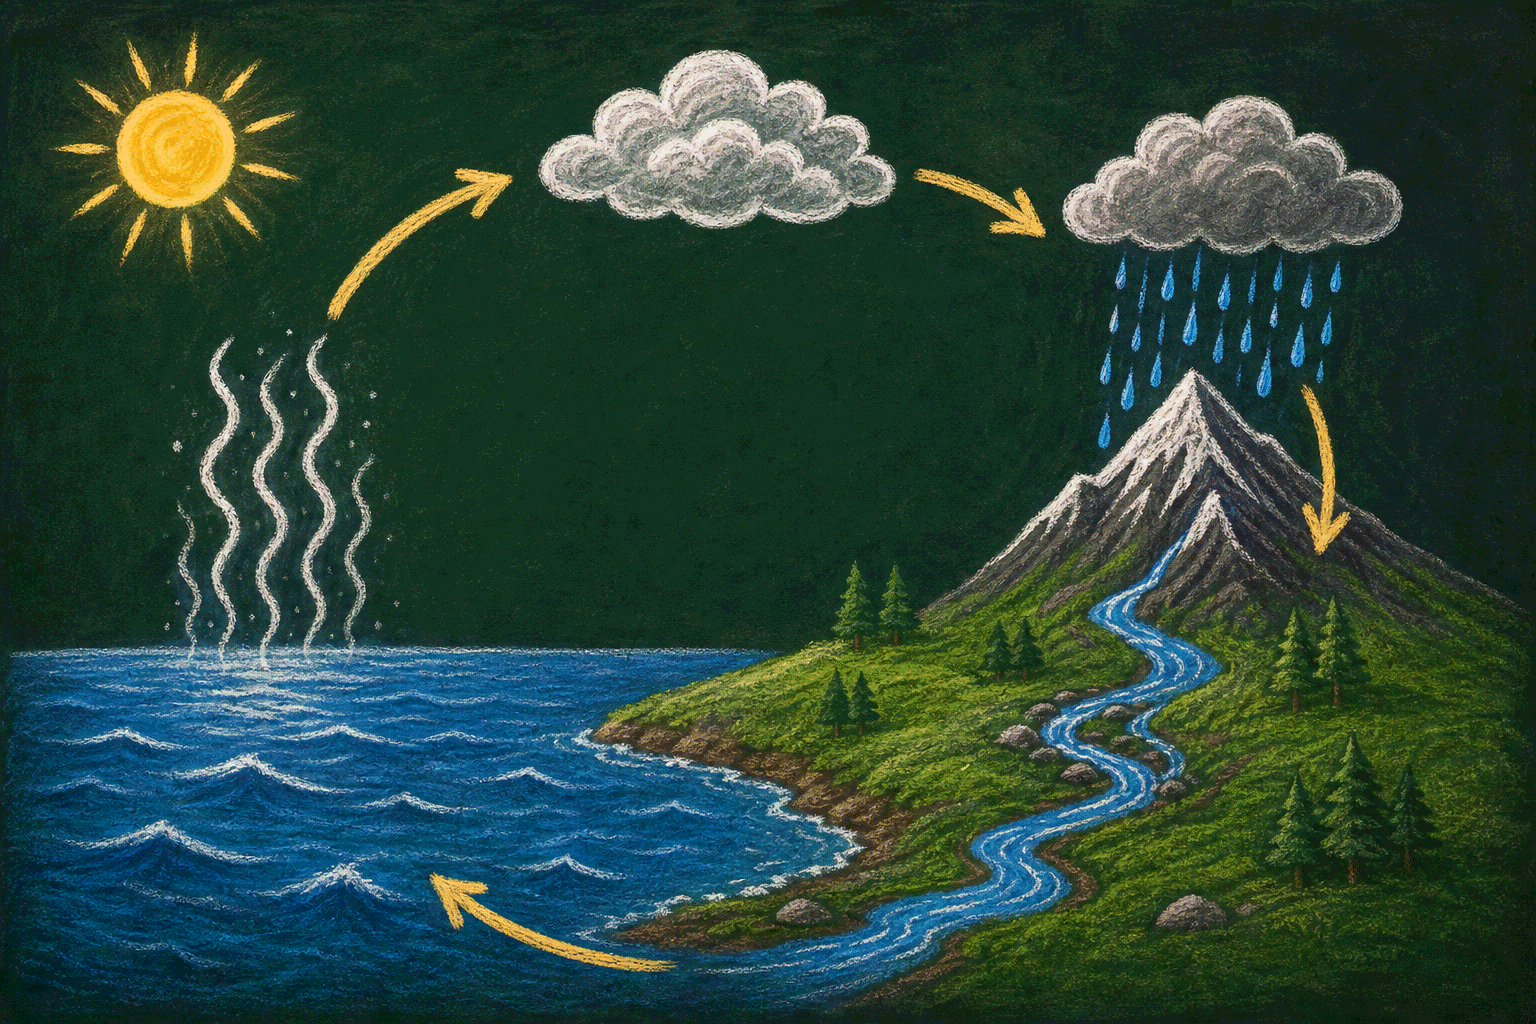
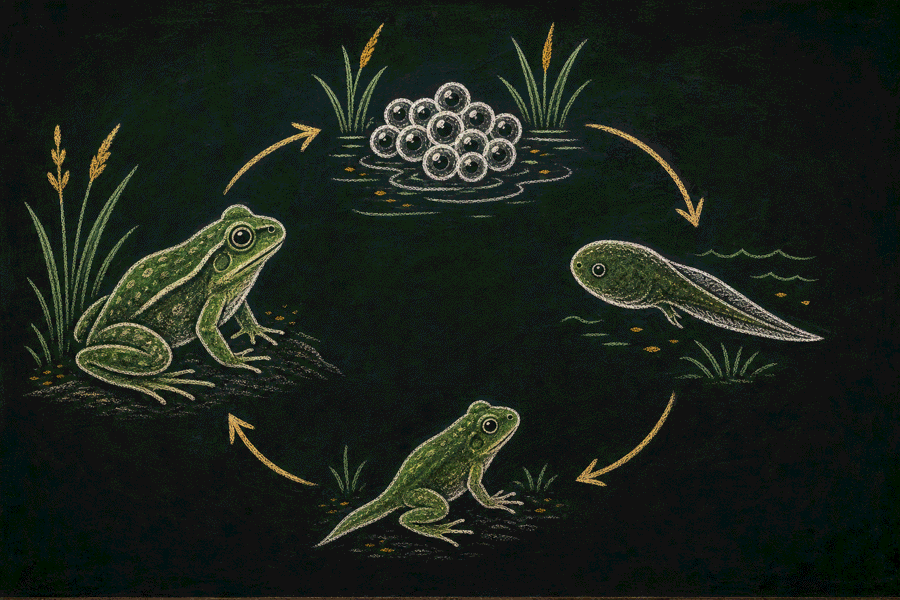
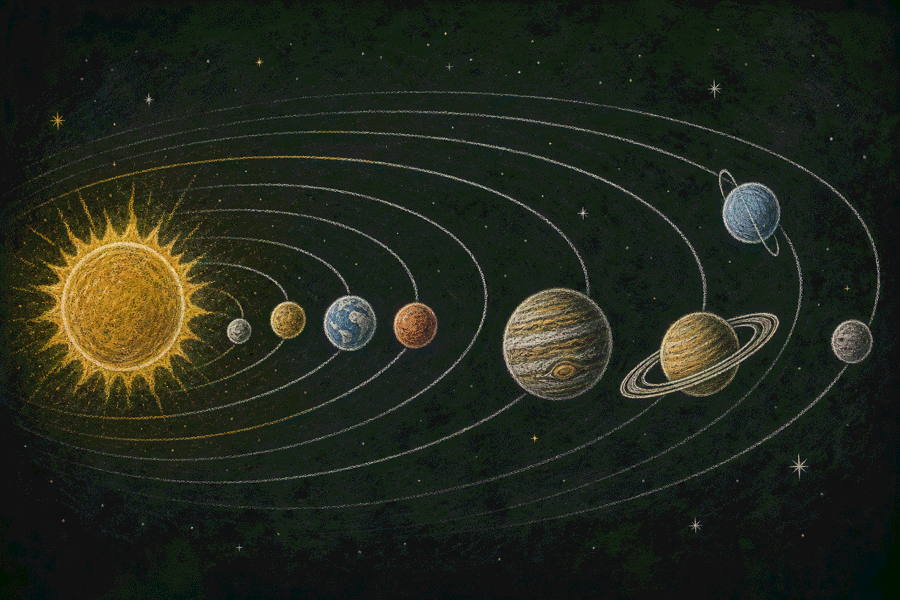
Primary science topics explained simply, with a labelled diagram where it helps.
Geography
Placing the world on a map, from continents to the fifty states.
 How to teach the continents and oceansGrade 1 to Grade 5How to teach the US states and capitalsGrade 3 to Grade 6How to teach the countries of EuropeGrade 3 to Grade 6How to teach the Canadian provinces and territoriesGrade 3 to Grade 6How to teach the countries of South AmericaGrade 3 to Grade 6How to teach the countries of AsiaGrade 3 to Grade 6How to teach the countries of AfricaGrade 3 to Grade 6How to teach the countries of West Asia and the Middle EastGrade 3 to Grade 6How to teach the countries, cities and counties of the United KingdomGrade 2 to Grade 6
Reading & writing
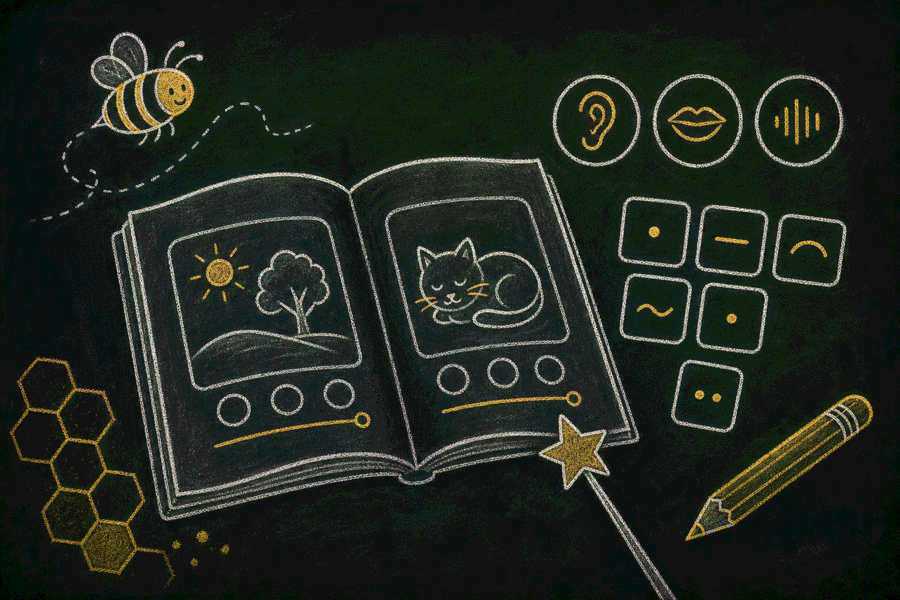
Early literacy skills that support the worksheets.
Vocabulary
Growing word knowledge: synonyms, antonyms, homophones and working out meaning from context.
Grammar
The nuts and bolts of correct sentences, starting with verb tenses.
Thinking & reasoning
Logic and reasoning puzzles that sharpen how children classify, compare and infer.
 How to teach sorting and classifyingKindergarten to Grade 4How to teach sequencingKindergarten to Grade 4How to teach odd-one-out puzzlesGrade 1 to Grade 6How to teach number patternsGrade 2 to Grade 6How to teach analogiesGrade 2 to Grade 6How to teach fact and opinionGrade 3 to Grade 6How to use mazes in the classroomPre-K to Grade 3